Last year, the National League snapped a 14-year regular-season streak of being beaten up by its little brother, going 158-142 in interleague play (not counting the World Series, which went the AL’s way). For the first time since 2003, the Senior Circuit was the superior league. It was also, in most respects, the more entertaining one.
Last year’s AL had no notable upsets; the four preseason favorites made it to the playoffs without too much trouble. The A’s exceeded expectations, but they weren’t without their preseason supporters, and they didn’t top any teams that were widely considered contenders. The Indians ran away with the Central (which was the second-weakest division ever), the Red Sox held a fairly commanding lead down the stretch in the East, and although the A’s and the Mariners made the West closer than it looked this time last year, the Astros were never in serious trouble. One of the AL’s only sources of September suspense was the Orioles’ and Royals’ race to the bottom.
The NL, meanwhile, had a huge upset in the East and an unprecedented two tiebreakers, thanks to season-long dogfights in the West, Central, and wild-card race that required more than 162 contests to settle. Since last season, many NL teams have been busy upgrading their rosters, while a lot of AL teams have stood pat, either secure in their status as playoff locks or resigned to waiting till next year. As a result, it’s looking like the NL is easily baseball’s best hope for a riveting 2019.
In the AL, Yankees–Red Sox remains a heavyweight bout, albeit between two teams that will likely qualify for the postseason in one way or another. The Astros still seem to have a stranglehold on the West, and the Indians, even after a largely inactive offseason, still look like titans in the Central. The fight for the second wild card offers at least a little intrigue, but besides that, the biggest team-level questions in the AL are whether every other AL Central club combined could beat the Indians or whether the Royals can bring back the ’80s en route to what’s likely to be a fourth- or fifth-place finish. It seems almost certain—or as certain as the outcome of a six-month season can be in mid-March—that most of the AL’s pennant races will have run their course before the final leg of the regular season, leaving plenty of time for teams to play out the string.
Compare that to the considerable uncertainty in the NL, the locus of much of the winter’s activity. Even with the Machado-equipped Padres on the rise and the Rockies retaining most of the team that challenged Los Angeles last year, the Dodgers, according to FanGraphs’ projected standings, are sitting atop a 12-game theoretical cushion as they pursue their seventh consecutive division title and third consecutive pennant. In the Central and East, though, there’s little daylight between the best teams.
With a few exceptions—the Cubs and Pirates mostly sat on their hands, while the Marlins extended a time-honored tradition of dealing their stars—every team in those two divisions added an impact player, if not multiple impact players, over the past few months. The Cardinals (Paul Goldschmidt), Brewers (Yasmani Grandal), Reds (Yasiel Puig, Sonny Gray), Braves (Josh Donaldson), Mets (Robinson Canó, Edwin Díaz, Jed Lowrie), Nationals (Patrick Corbin), and Phillies (Bryce Harper, J.T. Realmuto, Jean Segura) all called in the cavalry, and because they invested while other teams treaded water, we’re left with two contrasting leagues.
We can quantify how lopsided the leagues are from a parity perspective—and how exciting the NL Central and East are likely to look—by comparing current expected standings to past preseason projections. Former FanGraphs writer Jeff Sullivan, who recently joined the Rays’ front office, amassed an archive of public projections extending back to 2005, which he used to produce many posts for the site and shared with me before he left to take on the AL East superpowers. The archive is an amalgam of various projection systems and methods, which isn’t ideal for comparative purposes, but it’s the best we can do; no system has stayed static throughout that 15-season span. Fortunately, most projection systems operate along similar lines and haven’t changed or improved drastically during that time. For 2019, I’m relying on FanGraphs’ projections, which are derived from a blend of the ZiPS and Steamer projection systems, coupled with the site’s manually maintained playing-time estimates.
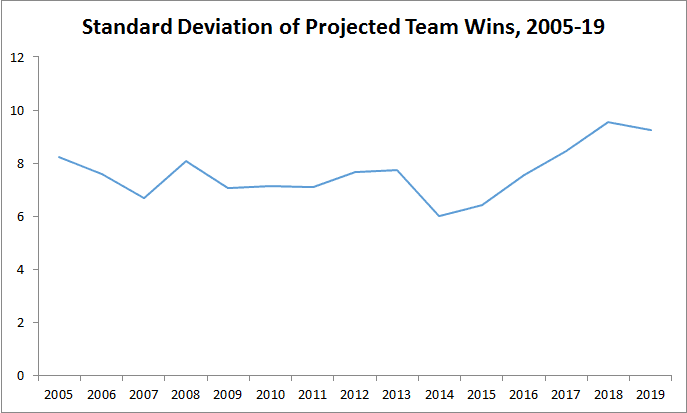
The first thing to note is that MLB’s ongoing superteam era has led to more scattered preseason projections. The standard deviation of projected team wins—a measure of how closely the projected team totals have clustered around the mean—has been higher in each season from 2017 to 2019 than it was in any previous season in the sample. In other words, there’s less proximity between the projected team totals, with a wider separation between the presumptive playoff teams and the probable laggards.

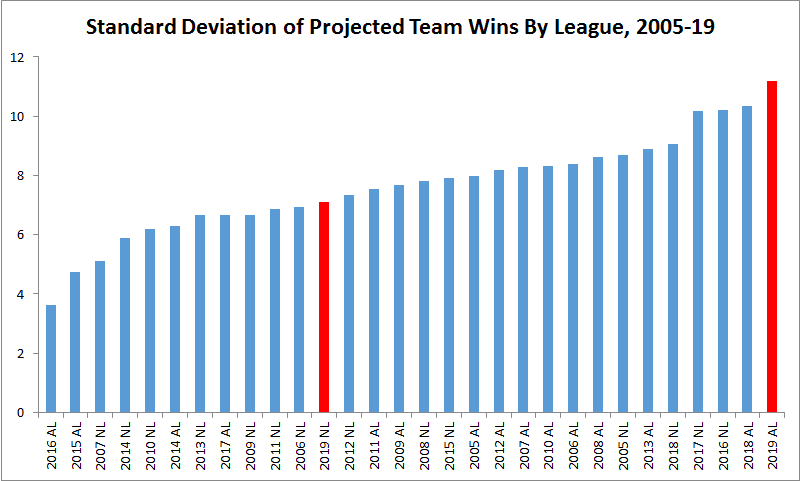
Fifteen seasons gives us a sample of 450 teams, 90 divisions, and 30 leagues. If we chart the standard deviations of projected team wins by league, we can see how this season’s circuits stack up. The 2019 NL and AL are represented in red on the graph below; a lower bar indicates a more tightly packed competitive picture, while a higher bar indicates a more lopsided league.

Despite the scrums in the NL East and Central, this year’s NL rates as only 12th-most-compressed of the 30 leagues, thanks to the lowly Marlins and the mostly mediocre West. More intuitively, the 2019 AL shows up as the most lopsided league on record, surpassing last year’s AL, which held the previous high. The projections suggest that this year’s AL is just as spread out—and as devoid of compelling playoff races—as it seems. Only in 2016 was the standard-deviation difference between two leagues in the same season larger than this year’s, although that time it was the NL that seemed extra stratified and the AL where the wins were expected to be evenly distributed.
If we examine the standard deviations by division, this season’s hot spots start to come into focus. The table below lists this year’s six divisions alongside the standard deviations of their projected win totals and their ordinal and percentile ranks among the 90 divisions since 2005 (where a lower standard deviation equals a lower ordinal rank and a higher percentile rank).
2019 Division SD Ranks, 2005-19 (All Teams)
Granted, it takes only two competitive teams at the top to make a division somewhat exciting, and this is more a measure of how much gridlock all five members of each division are collectively expected to generate than it is an assessment of the likelihood that the winner won’t be decided early. Still, since we’re talking about balance, it’s no surprise to see this year’s NL Central—where all five teams, including the anti-competitive Pirates, fall within a projected range of 10 wins—close to the top of the list, with only the 2010 AL West and the 2015 AL East ahead of it. The former was a four-team division, which makes it easier to post a smaller spread, and the latter lived up to its balanced billing, with all four also-rans finishing within 15 games of victorious Toronto.
On the opposite end of the spectrum, this year’s AL East ranks as the least-balanced division on record, by virtue of a projected range of 35 wins between the Yankees and Orioles and sizable gaps between the Red Sox and Rays and the Rays and the Jays. The other 2019 divisions line up between those two poles. It’s a testament to how terrible the Marlins are that the NL East ranks as low as it does despite the division’s top four teams sporting projected win totals within a span of six games.
But what if we lived in a world without the Marlins? (Ah, would that we could.) Let’s redo that divisional breakdown but this time take only the top four projected teams from each one. Lopping off the last-place teams from each division in the sample except the four-team, pre-2013 AL Wests changes 2019’s competitive picture.
2019 Division SD Ranks, 2005-19 (Top Four Teams)
Now things look exactly like we thought they would. The NL East and Central are the clear class of baseball, boasting standard deviations less than half as large as any of the other divisions. Each of the three NL divisions figures to be more bunched up than any of the AL divisions, reinforcing the NL’s edge in spectator appeal. Lastly, the AL Central especially sucks. Sounds about right.
If there’s any consolation for AL loyalists—to the extent that anyone actually feels loyal to one league in the era of season-long interleague play—it’s that the state of the leagues can shift quickly; we’re just a few years removed from the AL, in the aggregate, being both the better and the more compelling league. In light of last year’s results and this winter’s transactions, there’s every indication that the NL will again be the bigger threat in interleague play. More than that, though, the NL—and its enticing East and Central logjams, specifically—are going to be baseball’s best selling points in 2019.

